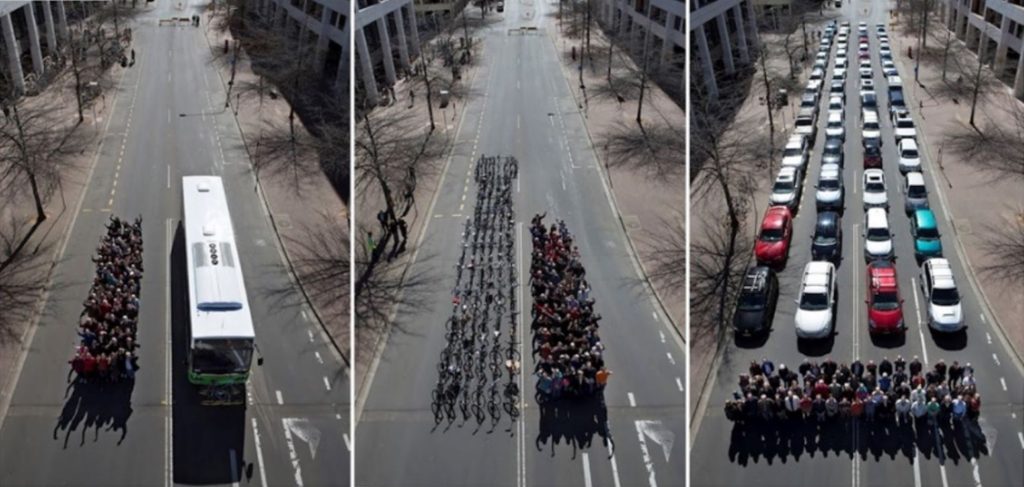
In dense cities, space is a scarce resource. There is a significant difference in the space used by transport modes. Active modes, such as walking or cycling, are up to twenty times more space-efficient than the average car. Indeed, car-based transport systems require a set of infrastructures that include roads and parking spots.
Even though the picture comparing the space used by different transport modes is rather famous, the spatial footprint concept is seldom used. What is the aim of the spatial footprint indicator and how to measure it?

What is the spatial footprint of transports?
The “transport spatial footprint” is defined here as an indicator in m² representing the surface allocated to transports in the city. In theory, one could distinguish between the space used by transports – i.e. the space consumed by the different vehicles – and the space allocated to transport – i.e. the whole road network, parking spaces, sidewalks and cycle tracks.
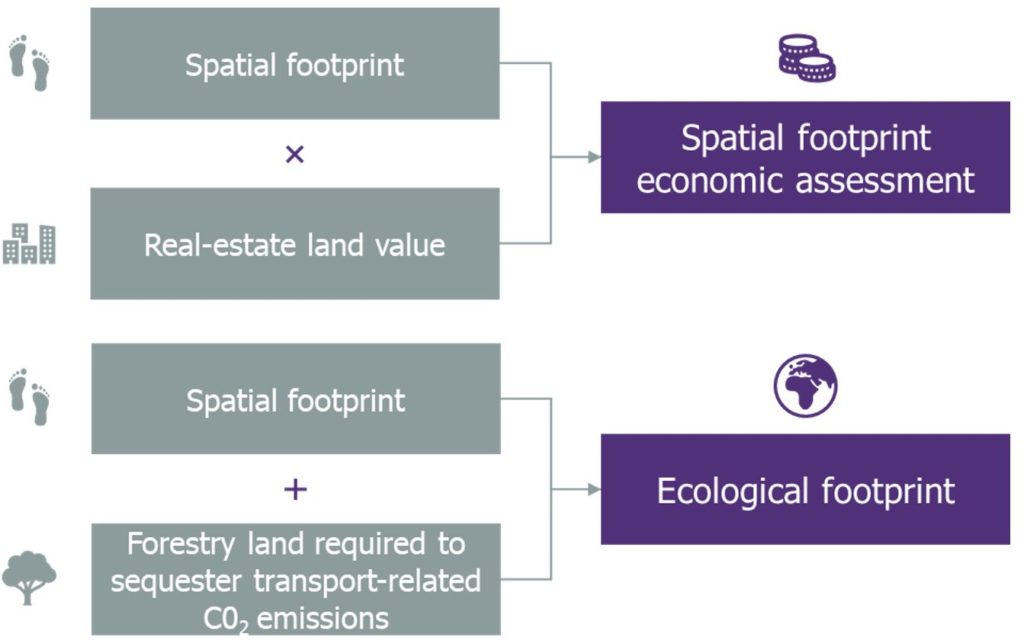
Measuring the space used by transports takes more concrete a meaning when the economic and environmental impacts involved in the spatial footprint are considered. Two derived indicators can be built to showcase the significance of the space allocated to transport in economic and environmental terms, and thereby illustrate the different impacts encompassed by the spatial footprint concept.
The economic evaluation of the space used by transports is the space allocated to transports multiplied by the land real estate value. This gives a monetary value of the transport spatial footprint.
The ecological transport footprint can be calculated by adding the space allocated to transports to the forestry land required to sequester the transport-related CO2 emissions.

What does the indicator address?
First, the spatial footprint points at a major root of road congestion, and therefore offers a strong argumentation in favor of space efficient transportation, such as active modes of transport, public transport and collaborative mobility solutions.
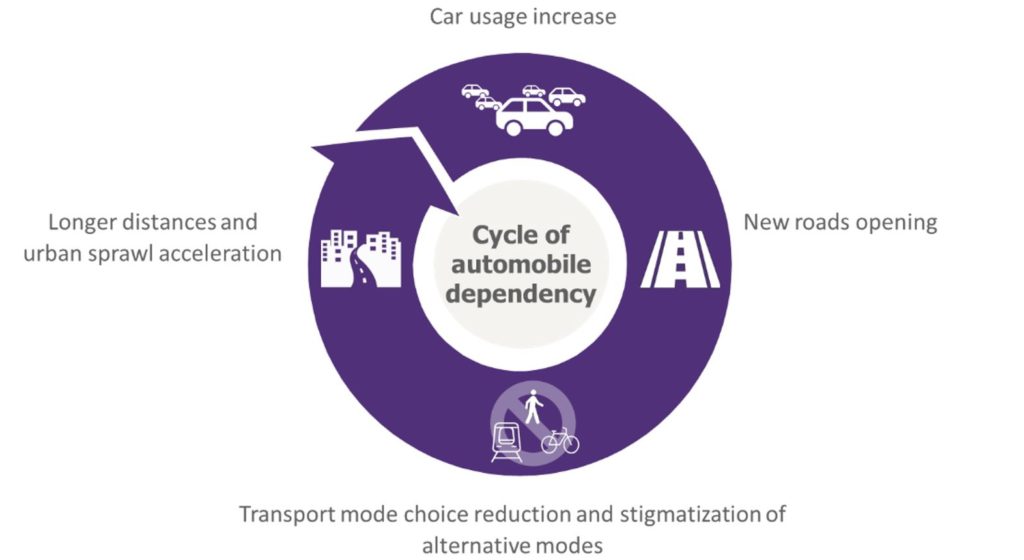
Air pollution and road congestion are the main drawbacks of car-based transport systems. If pollution can be mitigated thanks to cleaner fuels, tackling congestion may entail more structuring changes. Building new roads to answer the increasing car traffic need is indeed often the first step in a cycle of automobile dependency. Extending the road network creates longer traveling distances and stigmatizes transport modes competing with cars. This promotes suburbanization and urban sprawl, which in turn creates more car traffic.

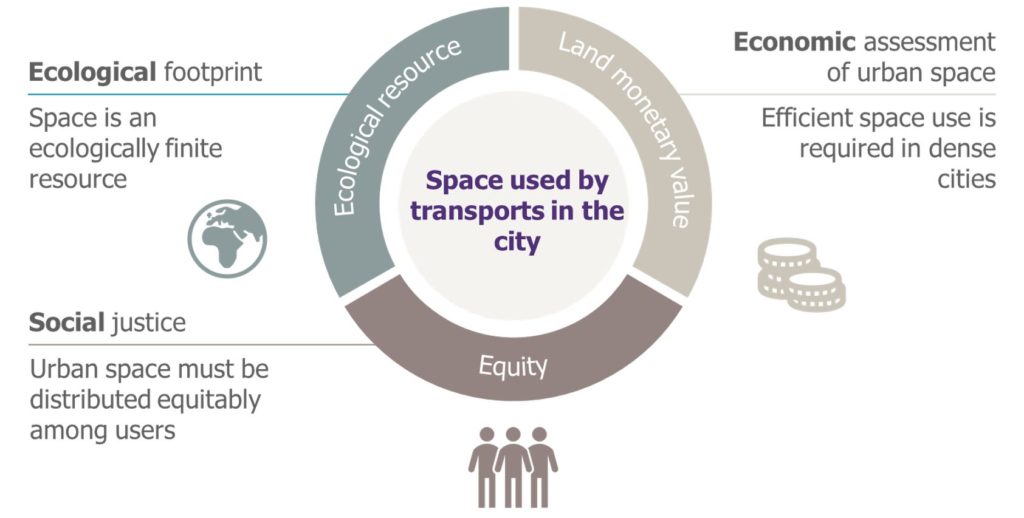
Secondly, the transport spatial footprint paves the way for an ecological, economic and social discussion, which puts the indicator at the heart of sustainable development.
- The ecological transport footprint highlights the fact that space is a finite resource and the necessity to use it in an optimal way
- The economic assessment showcases the common financial benefit brought about by optimizing urban space use
- It is known that transport mode choice changes with a traveler’s socio-economic backgrounds. People from poorer backgrounds travel less by car, and women use public transports more than man for example. The “transport spatial footprint” by transport mode gives some information on urban space distribution equity among different citizen categories.

How to measure the spatial footprint of transport in the city?
If the concept sounds rather straightforward, the operationalization may prove more complex.
Here are four studies that have been realized on the subject:
- Louis Marchand, an engineer from the RATP (Paris’ public transport operator) introduced in year 1984 a transport space-time consumption indicator. He suggested as an illustrative application a monetization of the space consumption by transport mode. It appears that for a 5-km journey, pedestrians are the spatially cheaper travelers, followed by public transports, two-wheelers and individual cars (up to 10 times more expensive than pedestrians).
- The CEREMA, French center for studies on risk, mobility and environment, published in 2007 a study on space consumption by transports and urbanization. The report defines a space occupation rate by transport infrastructures as the percentage of the available land in a given city. Available land-use data are utilized to calculate the space occupation rate. The study of 7 mid-sized cities in France gives a transport occupation rate of between 10 and 25% of the total city size.
- Two French researchers in transport economics issued in 2008 a study on space-time consumption by transport modes in the Paris area. They evaluated that in Paris, 27% of the city surface is dedicated to transports, with 57% of the ground transport space dedicated to cars.
- More recently, in 2016, a team of German researchers carried out a case study on Fribourg, Germany, measuring the space allocated to the different transport modes thanks to high resolution satellite images. They evaluated that an average of 19% of the city space is dedicated to transports, with 55% of it allocated to cars.
Those figures are better interpreted in the light of a specific framework, such as space distribution equity among transport users or economic efficiency among modes. A good analysis scope would also define how underground or aboveground infrastructures are included in the calculation.
Spatial footprint measurements have not been used much. Massive urbanization and rampant motorization around the globe may nevertheless put spotlight on the issue. This could be translated into targeted objectives of urban sprawl for example, or a “space tax” similar to the carbon tax on modes that are high space consumers.
